
Debt-to-GDP Ratio Explained: Meaning, Importance, and India’s Debt Trend in Detail
The Debt-to-GDP ratio is one of the most closely watched indicators of a country’s economic health. Governments, credit rating agencies, investors, and international institutions use it to assess whether a country’s debt level is sustainable, manageable, or risky.
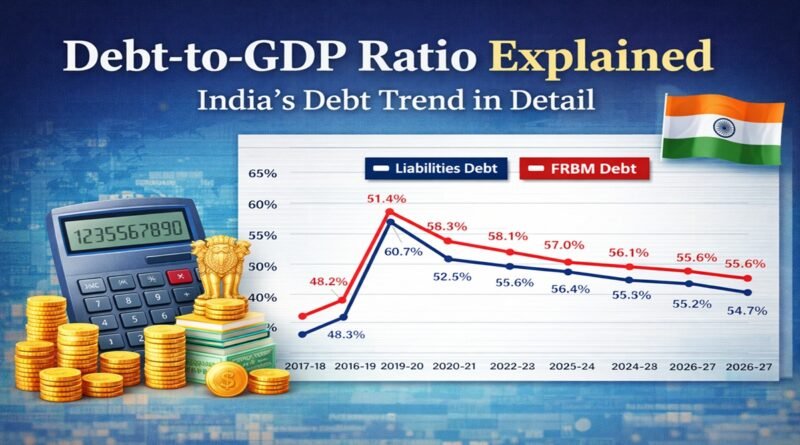
In recent years, especially after the COVID-19 pandemic, India’s debt-to-GDP ratio has received significant attention. The trend shown in the official data reveals a sharp rise during the pandemic years, followed by a gradual consolidation phase.
This article explains:
- What Debt-to-GDP ratio means
- Why it matters
- How it is measured
- And a detailed analysis of India’s debt trend, using the data shown in the uploaded chart
Read this: Trade Deficit, Fiscal Deficit and Other Types of Deficits Explained in Detail
What Is Debt-to-GDP Ratio?
The Debt-to-GDP ratio compares a country’s total public debt to its Gross Domestic Product (GDP).
Simple Definition
It shows how much a country owes compared to how much it earns in a year.
Formula
Debt-to-GDP Ratio = (Total Government Debt ÷ GDP) × 100
Example
If:
- Government debt = ₹100 lakh crore
- GDP = ₹200 lakh crore
➡️ Debt-to-GDP ratio = 50%
This means the country’s debt is equal to half of its annual economic output.
Why Is Debt-to-GDP Ratio Important?
Debt alone does not indicate danger. What matters is debt relative to economic capacity.
The ratio helps to understand:
- A government’s ability to repay debt
- Long-term fiscal sustainability
- Creditworthiness of a country
- Pressure on future budgets
- Risks of inflation and interest burden
A high ratio can be manageable if:
- Growth is strong
- Interest rates are low
- Debt is mostly domestic
How Is Government Debt Defined in India?
India tracks public debt using two official definitions, both visible in the uploaded chart:
1. Debt as per Statement of Liabilities (Receipt Budget)
- Broader accounting definition
- Includes internal liabilities and public account liabilities
- Shown as the blue line in the chart
2. Debt as Defined in the FRBM Act
- Narrower and more conservative definition
- Includes:
- External debt at current exchange rate
- Liabilities arising from extra-budgetary resources
- Shown as the red line in the chart
The FRBM (Fiscal Responsibility and Budget Management) Act sets targets and glide paths for debt reduction.
India’s Debt-to-GDP Trend: What the Data Shows
The uploaded chart titled “Trends in Debt (% of GDP)” shows India’s debt trajectory from 2017–18 to 2026–27 (BE).
Phase 1: Pre-Pandemic Stability (2017–18 to 2019–20)
Key Observations
- Debt-to-GDP ratio remained below 50% till 2019–20
- FRBM-defined debt:
- 48.9% (2017–18)
- 49.3% (2018–19)
- 52.3% (2019–20)
- Statement of Liabilities debt:
- Around 48%–51%
Interpretation
- India was on a moderately stable fiscal path
- Rising but controlled borrowing
- Economic growth helped contain debt levels
Phase 2: Pandemic Shock (2020–21)
Sharp Spike in Debt
- FRBM-defined debt jumped to 61.4% of GDP
- Statement of Liabilities debt rose to 60.7%
Why Did This Happen?
- COVID-19 lockdowns collapsed revenues
- Emergency health spending increased
- Welfare schemes expanded
- GDP contracted sharply
Even without reckless borrowing, GDP denominator fell, pushing the ratio higher.
Key Insight
👉 This spike was cyclical, not structural.
Phase 3: Gradual Consolidation (2021–22 to 2023–24)
Debt Trend
- FRBM debt declined:
- 58.8% (2021–22)
- 58.1% (2022–23)
- 57.0% (2023–24)
- Statement of Liabilities debt fell to 56.4%
What Helped?
- Economic recovery
- Nominal GDP growth
- Gradual fiscal consolidation
- Improved tax collections
Interpretation
India began repairing its balance sheet without aggressive austerity.
Phase 4: Medium-Term Outlook (2024–25 to 2026–27 BE)
Projected Debt Levels
- FRBM-defined debt:
- 56.2% (2024–25)
- 56.1% (2025–26 RE)
- 55.6% (2026–27 BE)
- Statement of Liabilities debt:
- Declining to 54.7% by 2026–27
What This Indicates
- Clear downward glide path
- Commitment to fiscal discipline
- Alignment with FRBM objectives
India aims to stabilize debt before reducing it further.
Is India’s Debt-to-GDP Ratio High?
In Global Comparison
- Advanced economies: 90%–120%
- Japan: over 250%
- Emerging markets: 60%–70%
India’s level (~55%–56%) is moderate.
Why India’s Debt Is Relatively Manageable
- Majority of debt is domestic
- Long maturity structure
- Limited foreign currency exposure
- Strong nominal GDP growth
Risks Associated with High Debt
Even manageable debt has risks:
- Higher interest payments
- Reduced fiscal space
- Pressure on future social spending
- Vulnerability during global shocks
That is why debt reduction is gradual, not abrupt.
Debt-to-GDP vs Fiscal Deficit: Key Difference
| Aspect | Debt-to-GDP | Fiscal Deficit |
|---|---|---|
| Nature | Stock | Flow |
| Timeframe | Accumulated | Annual |
| Measures | Total debt burden | Yearly borrowing |
| Policy Use | Sustainability | Budget control |
Fiscal deficit today adds to debt tomorrow.
Conclusion: India’s Debt Story in Perspective
India’s debt-to-GDP ratio tells a story of:
- Pre-pandemic stability
- Pandemic-induced shock
- Post-pandemic recovery
- Medium-term fiscal discipline
The data clearly shows that the rise in debt was extraordinary but temporary, and the government is now on a credible consolidation path.
Rather than chasing aggressive cuts, India is focusing on:
- Growth-led debt reduction
- Stable borrowing
- Long-term sustainability
A debt ratio is not dangerous by itself—what matters is the direction, composition, and growth capacity. On all three counts, India’s position remains manageable and improving.